59.8.3.10 SNMP filters
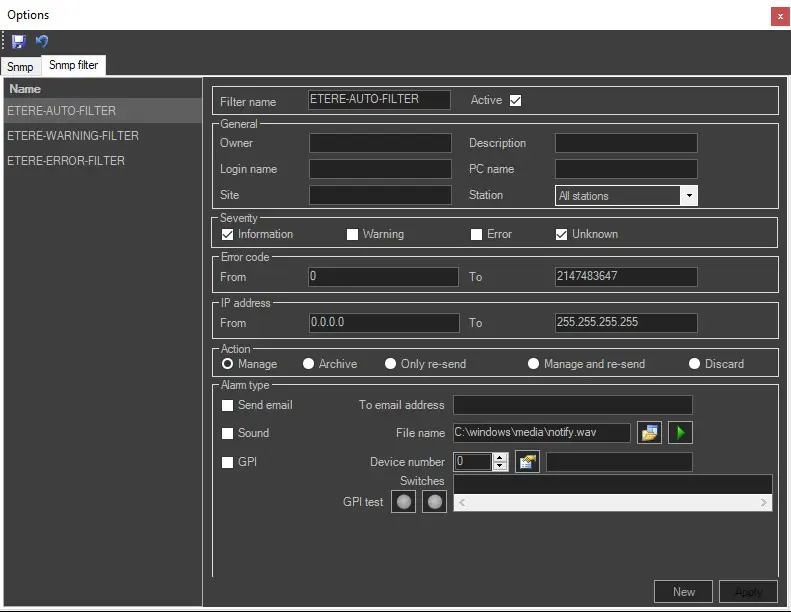
The Etere SNMP Console allows defining as many filtering profiles as necessary, thus allowing stations to deliver specific messages from specific resources to specific users. Every time an SNMP message is received, it will be analyzed, and in case it matches an SNMP Filter, all the filter-related actions and alarms will be performed:
snmp_filters
The SNMP Filters tab is divided into two sections: the list of filters positioned on the left hand and the filtering parameters on the right hand. When entering the parameter fields, you can use the "Tab" key to move from field to field to speed up the process instead of using the mouse pointer.
By default, Etere provides three filters:
• ETERE-AUTO-FILTER: It filters all general Information and unknown messages received from SNMP; all messages would not be archived into the database.
• ETERE-WARNING-FILTER: It filters the warning messages generated by SNMP; the warning messages would not be archived into the database. By default, the warning messages would not be shown.
• ETERE-ERROR-FILTER: It filters the error messages generated by SNMP, and the error messages are stored in the database. The user would manage the error messages.
To add a new filter, just click on the [New] button and define it by compiling the following fields, which represent the condition that has to be verified for the filter to receive a message:
• Filter name: Enter the filter's name here and indicate if it's active or inactive. Please note that one or more filters can be active contemporaneously, performing all the specified actions for the related filter in each case.
• Owner: The running application that triggers the SNMP message.
• Login name: The user name that is executing the application.
• Site: The site name where Etere applications were installed.
• Description: Enter the SNMP trap message or filter the SNMP trap by entering part of the message string in the trap description field, e.g. "Problem: CPU Temp is critical".
• PC name: The workstation's name where the application was running.
• Station: Select "All stations" or a user station (e.g. ETX, MAM, Nunzio, etc) where the abnormalities were detected.
• Severity: In these four fields, it's possible to select the type of message that the filter will detect; these are Information (0), Warning (1), Error (2) and Unknown (3).
• Error Code: Specify the range of error codes to be trapped. See Common SNMP Error Codes.
• IP Address: Narrow the reception of messages only to workstations belonging to a specific IP interval.
The following parameters define what the filter will do when it receives a message.
Actions: Every time the condition set on this filter occurs, a specific action can be executed:
Manage - Received messages will be stored and organized inside the database.
Archive - Received messages will be automatically archived into the database (i.e. they won't be shown by default),
Only-resend - Received messages will be forwarded to another console.
Manage and re-send - Received messages will be stored and organized inside the database; after that, they will be forwarded to another console.
Discard - Received messages won't be stored within the database; they will be ignored.
Alarm type: Here, it's possible to select the different ways of notification when a Snmp message arrives:
Send an email - Set here the email address to which a notification message will be sent every time a matching message is received. If no address is specified, the message "Invalid email" will be prompted to the user.
Sound - Set here the path to the sound file to be played every time a received message matches the current filter.
As the Monitoring Console plays sound alarms, the "Connection parameters > Receive trap mode" must be set to "directly by console," and the Monitoring Console must be opened.
GPI - Set here the GPI switches to be activated in case an SNMP message matching the current filter is received:
• Device number: Set here the device number of the device.
• Properties: Press this button to load into the "Switches" as many checkboxes as GPI switches are detected.
• Switches: Select all the switches to be activated here when SNMP messages match the current filter.
• GPI test: The red button activates all locally selected switches, whereas the grey button deactivates them. GPI status are visualized in the status bar of the Monitoring Console.
NB: Information on installing and using a GPI card for this purpose can be found in the GPI alarms chapter.
