7 Etere Dashboard
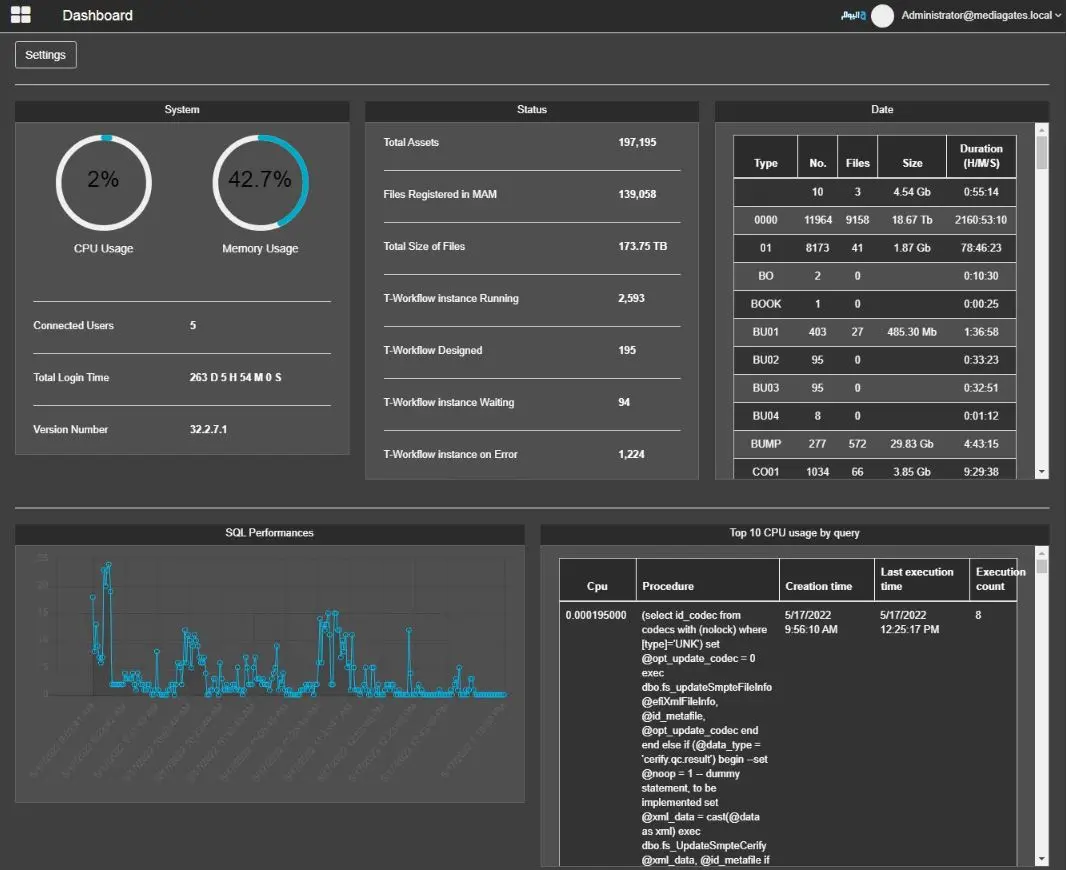
The Dashboard module provides a summary of system information on a single page.
Dashboard
System information
• Current CPU usage
• Current Memory usage
• Total number of connected users (The value must be greater than one if the Dashboard is displayed)
• Total login time of all users (The total login time must be written if at least one user can view the Dashboard)
• The current version of EtereWeb
Assets Status
• Total assets in the db
• Files registered in MAM
• Total size of files
• How many T-workflow instances are currently running
• How many T-workflow instances have been designed
• How many T-workflow instances are stationary on a wait action
• How many T-workflow instances are on error status
Data Information
• The asset types used in the system
• The number of the assets per type
• The number of files associated with the assets of each type
• The total file size of the files associated with the assets of each type
• The total duration of the files per type
SQL Performances and Top 10 CPU usage by query
This section provides a graph of the SQL server usage, captured periodically at a fixed interval of time.
In the panel on the right side, a table shows the top 10 queries that used more CPU, providing the amount of CPU, which is the procedure that was launched, when it was created, when it was executed for the last time and how much time did it take to complete.
NB: Any parameter value that cannot be retrieved will be displayed as “Unavailable”.
Full-text filters
If, after install, the full-text filters can't either be seen by the system or be retrieved launching the following query:
Select * from sys.fulltext_document_types order by document_type
the following message appears on the dashboard right after the page is loaded:
Fulltext filters not installed
EXEC sp_fulltext_service 'update_languages';
