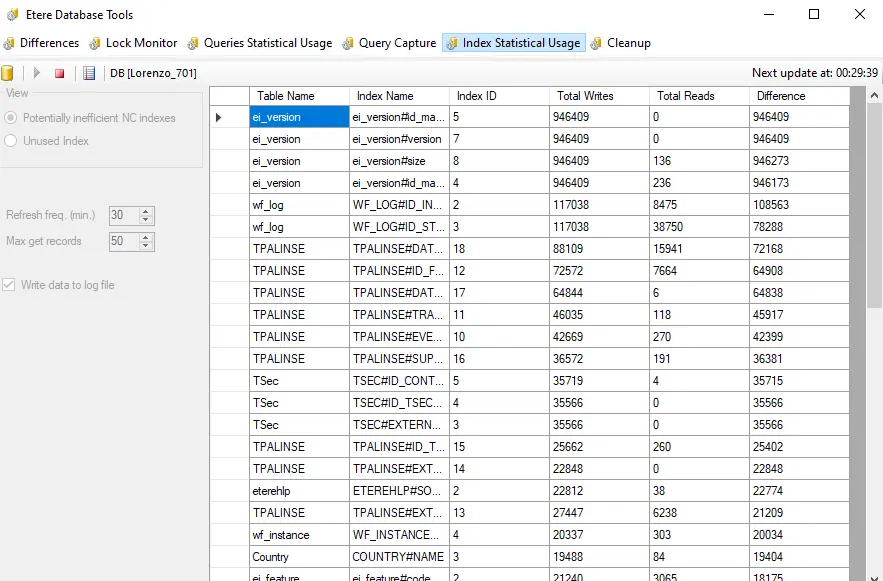
59.9.3.6 Index Statistical Usage
The "Index Statistical Usage" tab provides an interface to retrieve from the SQL Server some key statistics regarding the usage and performance of indexes, thus allowing the individuate of potentially unused indexes (i.e. written most of the time but rarely read).
Configure the following parameters and press the [Start] button to start the collection:
Index_Statistical_Usage
Potentially inefficient NC indexes: If selected, only non-clustered indexes considered potentially inefficient (i.e. wrongly used) will be retrieved.
Unused index: Only used/read indexes would be retrieved if selected.
Refresh freq. (min): Set the frequency (minutes) to retrieve the data.
Max. get records: Set the maximum number of records (single statistics) to be retrieved by the application.
Include query plan: If enabled, the query expected execution plan will be included in the output, showing the optimizer's calculations.
Free cache plan on Start: If enabled, the Query plan cache will be cleared before beginning to retrieve statistics.
Write data to log file: If enabled, all retrieved data will be recorded in a log file (i.e. dbutils.statqueyusage.log).
Functions
[Database]: Shows the database connection parameters (set in Etere Configuration > Settings > Basic > System), allowing to change the database name (e.g. to analyze a database different from the production one).
[Start]: Start retrieving statistics from queries.
[Stop]: Interrupt and stop the retrieval of statistics.
[Log]: Open the captured Log (i.e. dbutils.statindexusage.log).
Information analysis
Query information retrieved in the right panel can be analyzed based on the following key columns:
Total writes - Number of times the index has been reported.
Total reads - Number of times the index has been read (used). A "zero" value indicates that an index has never been read.
Difference - Balance between the times the index has been written and the times it has been read (used).
Higher values indicate potentially unused indexes; most of the time, it's written or not read.
